Your emissions inventory,
built to last.
Structure your Scope 1, 2 and 3 data using recognised methodology, 200+ expert-built templates and a single data backbone that feeds your footprint, your targets and every report you need to produce.

Built on recognized standards


Intuitive workflow
Define your boundary. Start measuring in minutes.
Set your organisational boundary, reporting period and applicable scopes in a guided setup. No methodology expertise required.
See how peer companies in your sector structure their inventory and where they typically leave gaps.
Adjust scopes and categories at any point as your reporting requirements evolve, without losing historical data.
200+ emission sources. Built from real projects
Activate pre-built emission source templates structured for your industry and reporting framework.
Each template includes the correct methodology, measurement units and emission factors. No manual lookup required.
Every template is compliant with GHG Protocol methodology and aligned with CSRD, GRI and CDP requirements.
.png)
Scope 1, 2, and 3. Full coverage, one place.
Scope 1. Direct emissions from owned and controlled sources, such as combustion, processes, fugitive releases.
Scope 2. Purchased energy calculated both location-based and market-based simultaneously and both required under GHG Protocol and CSRD.
Scope 3. Value chain emissions tracked across all 15 GHG Protocol categories, upstream and downstream.
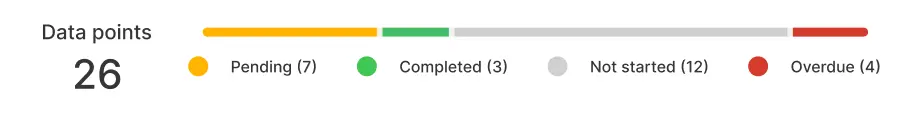
See where you stand. Know where to focus.
Carbon intensity metrics by revenue, headcount or output unit, with year-over-year trend tracking.
Peer benchmarks against companies in your sector, so you know whether your performance is improving relative to the market, not just in absolute terms.
Hotspot identification across scopes and categories. Reduction effort goes where the data says it matters most.
Carbon intensity
8
tCO2e per M€
Target
3%
reduction
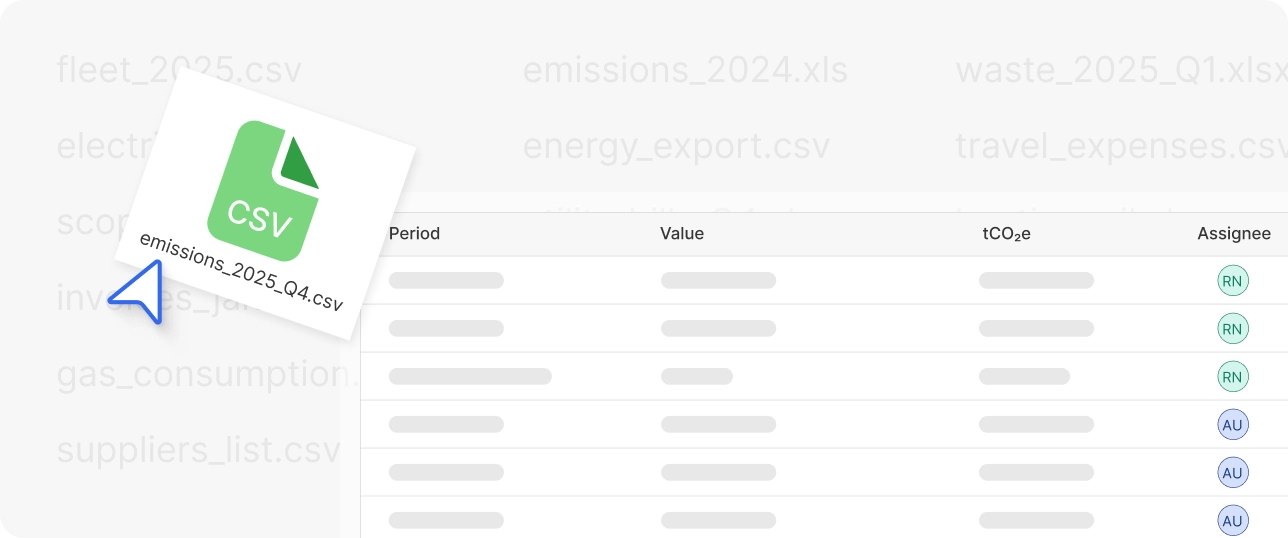
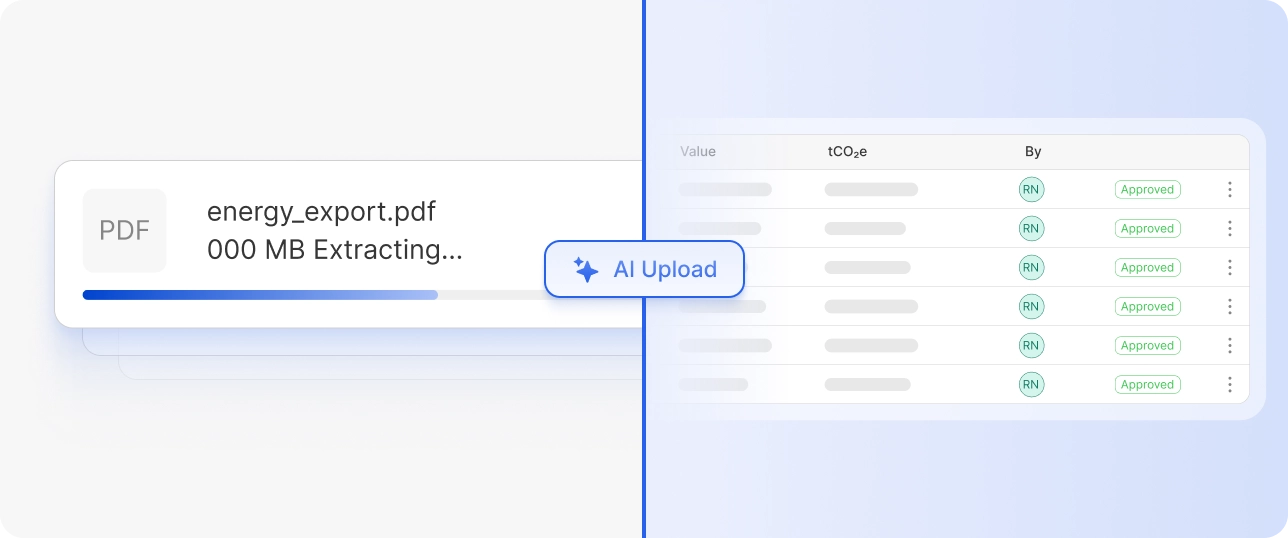
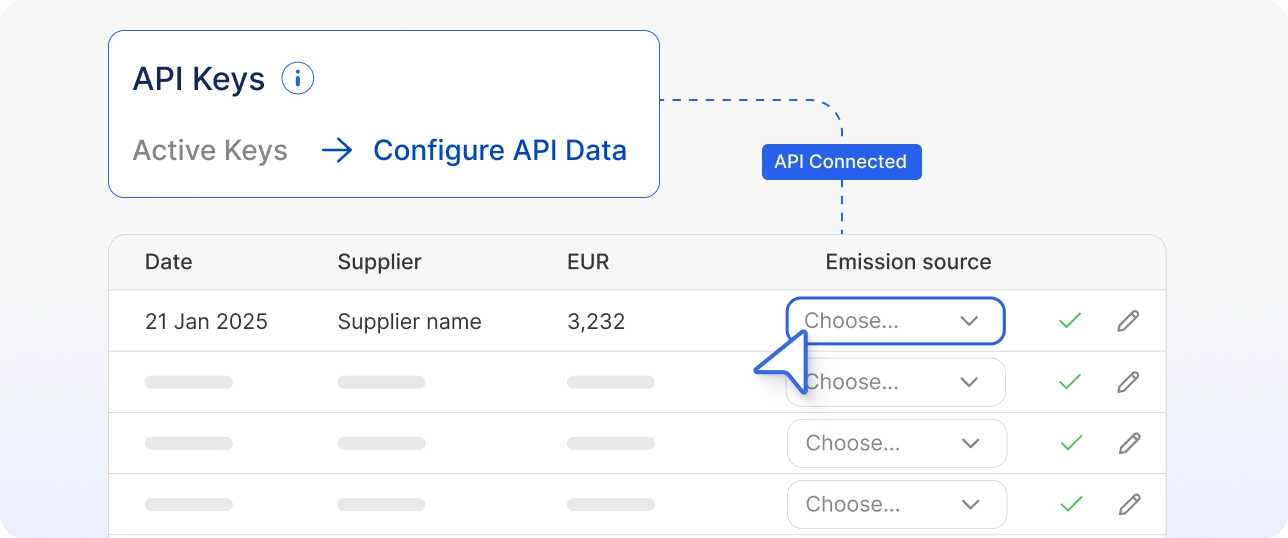
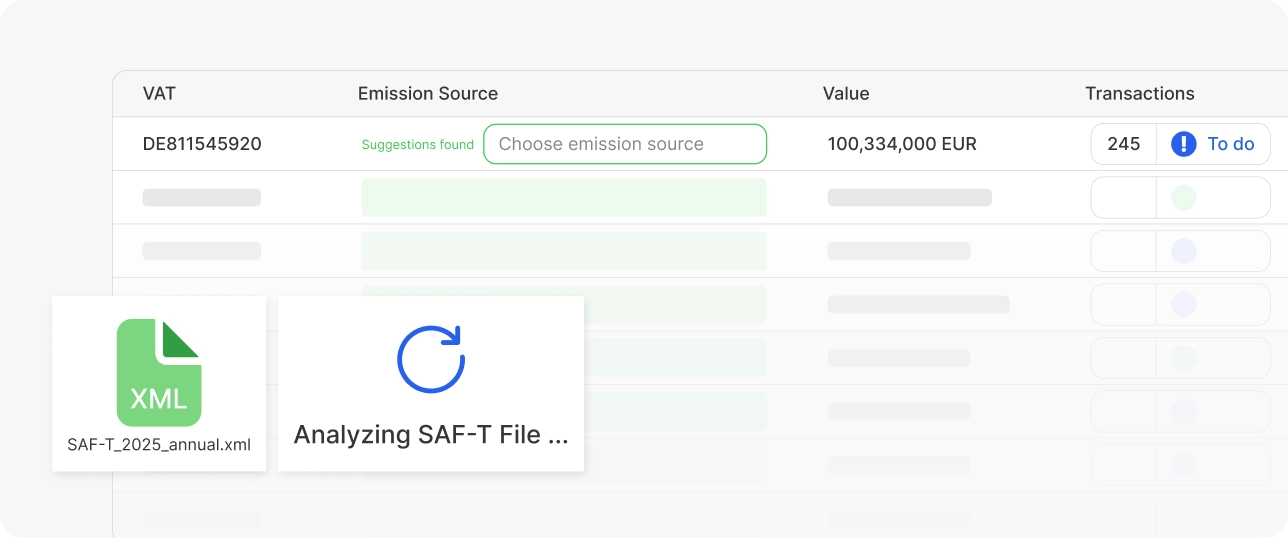
Five ways to import data
Five ways to get your emission data into CarbonTool. Start with one, add more as your process matures.
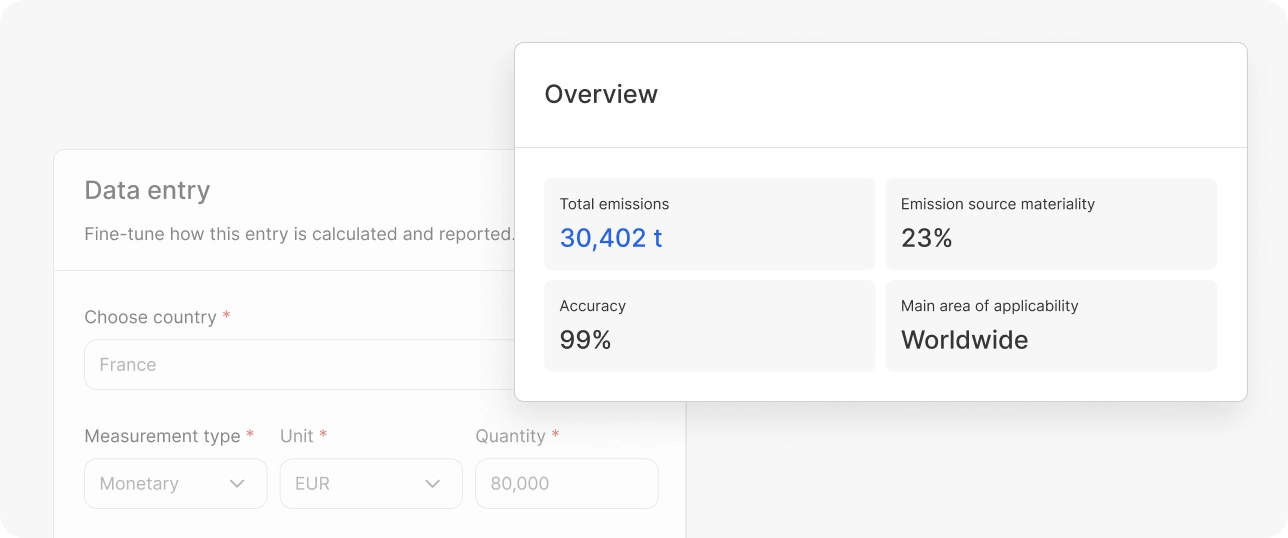
Manual
Enter activity data directly into structured emission source templates. Every field includes unit guidance, methodology context and suggested emission factors. You know what you are entering and why, not just where to type it.
Why companies choose CarbonTool

Tracked across all scopes
6,204,601 tCO₂e
Stay compliant
Meet CSRD, VSME, GRI, and CDP requirements on the same data backbone. Structure your data once, report across every framework without duplicate entry.
Cut costs
Starting at €2,000/year with unlimited users. No per-seat fees, no implementation consultants. Where most platforms charge €20,000–50,000+, CarbonTool gives you the same capabilities at a fraction.
Market advantage
Customers, investors, and regulators increasingly require emission data. Companies that measure early build credibility — and avoid the rush when reporting becomes mandatory.
Centralize all data
One platform for all scopes, all business units, all reporting periods. Replace scattered spreadsheets with a single data backbone that feeds your footprint, targets, scenarios, and reports.
Got more questions?
Can't find what you're looking for? Check the FAQs below, or reach out and we'll get back to you within one business day.
CarbonTool includes emission factors from internationally recognised databases, asuch as DEFRA, EPA, ecoinvent, ADEME, covering factors across geographies and industries. You can add custom factors or use supplier-specific data where available.
Yes. All paid plans include full Scope 3 coverage across all 15 GHG Protocol categories, such as purchased goods and services, capital goods, business travel, employee commuting, upstream and downstream logistics, use of sold products and more. The free Starter plan covers Scope 1 and 2.
A spreadsheet tracks numbers. CarbonTool tracks methodology. Every data point carries its source, unit, emission factor, data quality level and audit trail. When your auditor asks where a number came from, the platform answers that question automatically, without you having to reconstruct the calculation.
No. Every emission source template includes methodology context, unit guidance and suggested emission factors. Pathfinder guides your setup from boundary definition to first data entry. Optional onboarding is available from €400 if you want structured guidance from the team.
Gain Sustainability Insights
Your emissions data should be as structured
as your financial data .
CarbonTool gives you the methodology, the templates and the data backbone to build an inventory that holds up to auditor scrutiny and keeps holding up as reporting requirements evolve. Start free. No credit card, no sales call.